10  Enrichment ggraph

Tip

This section comprehensively utilizes a variety of bioinformatics tools and methods to process and analyze gene expression data.

Initially, differential expression genes are identified using methods such as DESeq2, edgeR, and limma-voom, followed by gene annotation conversion using the org.Hs.eg.db database.

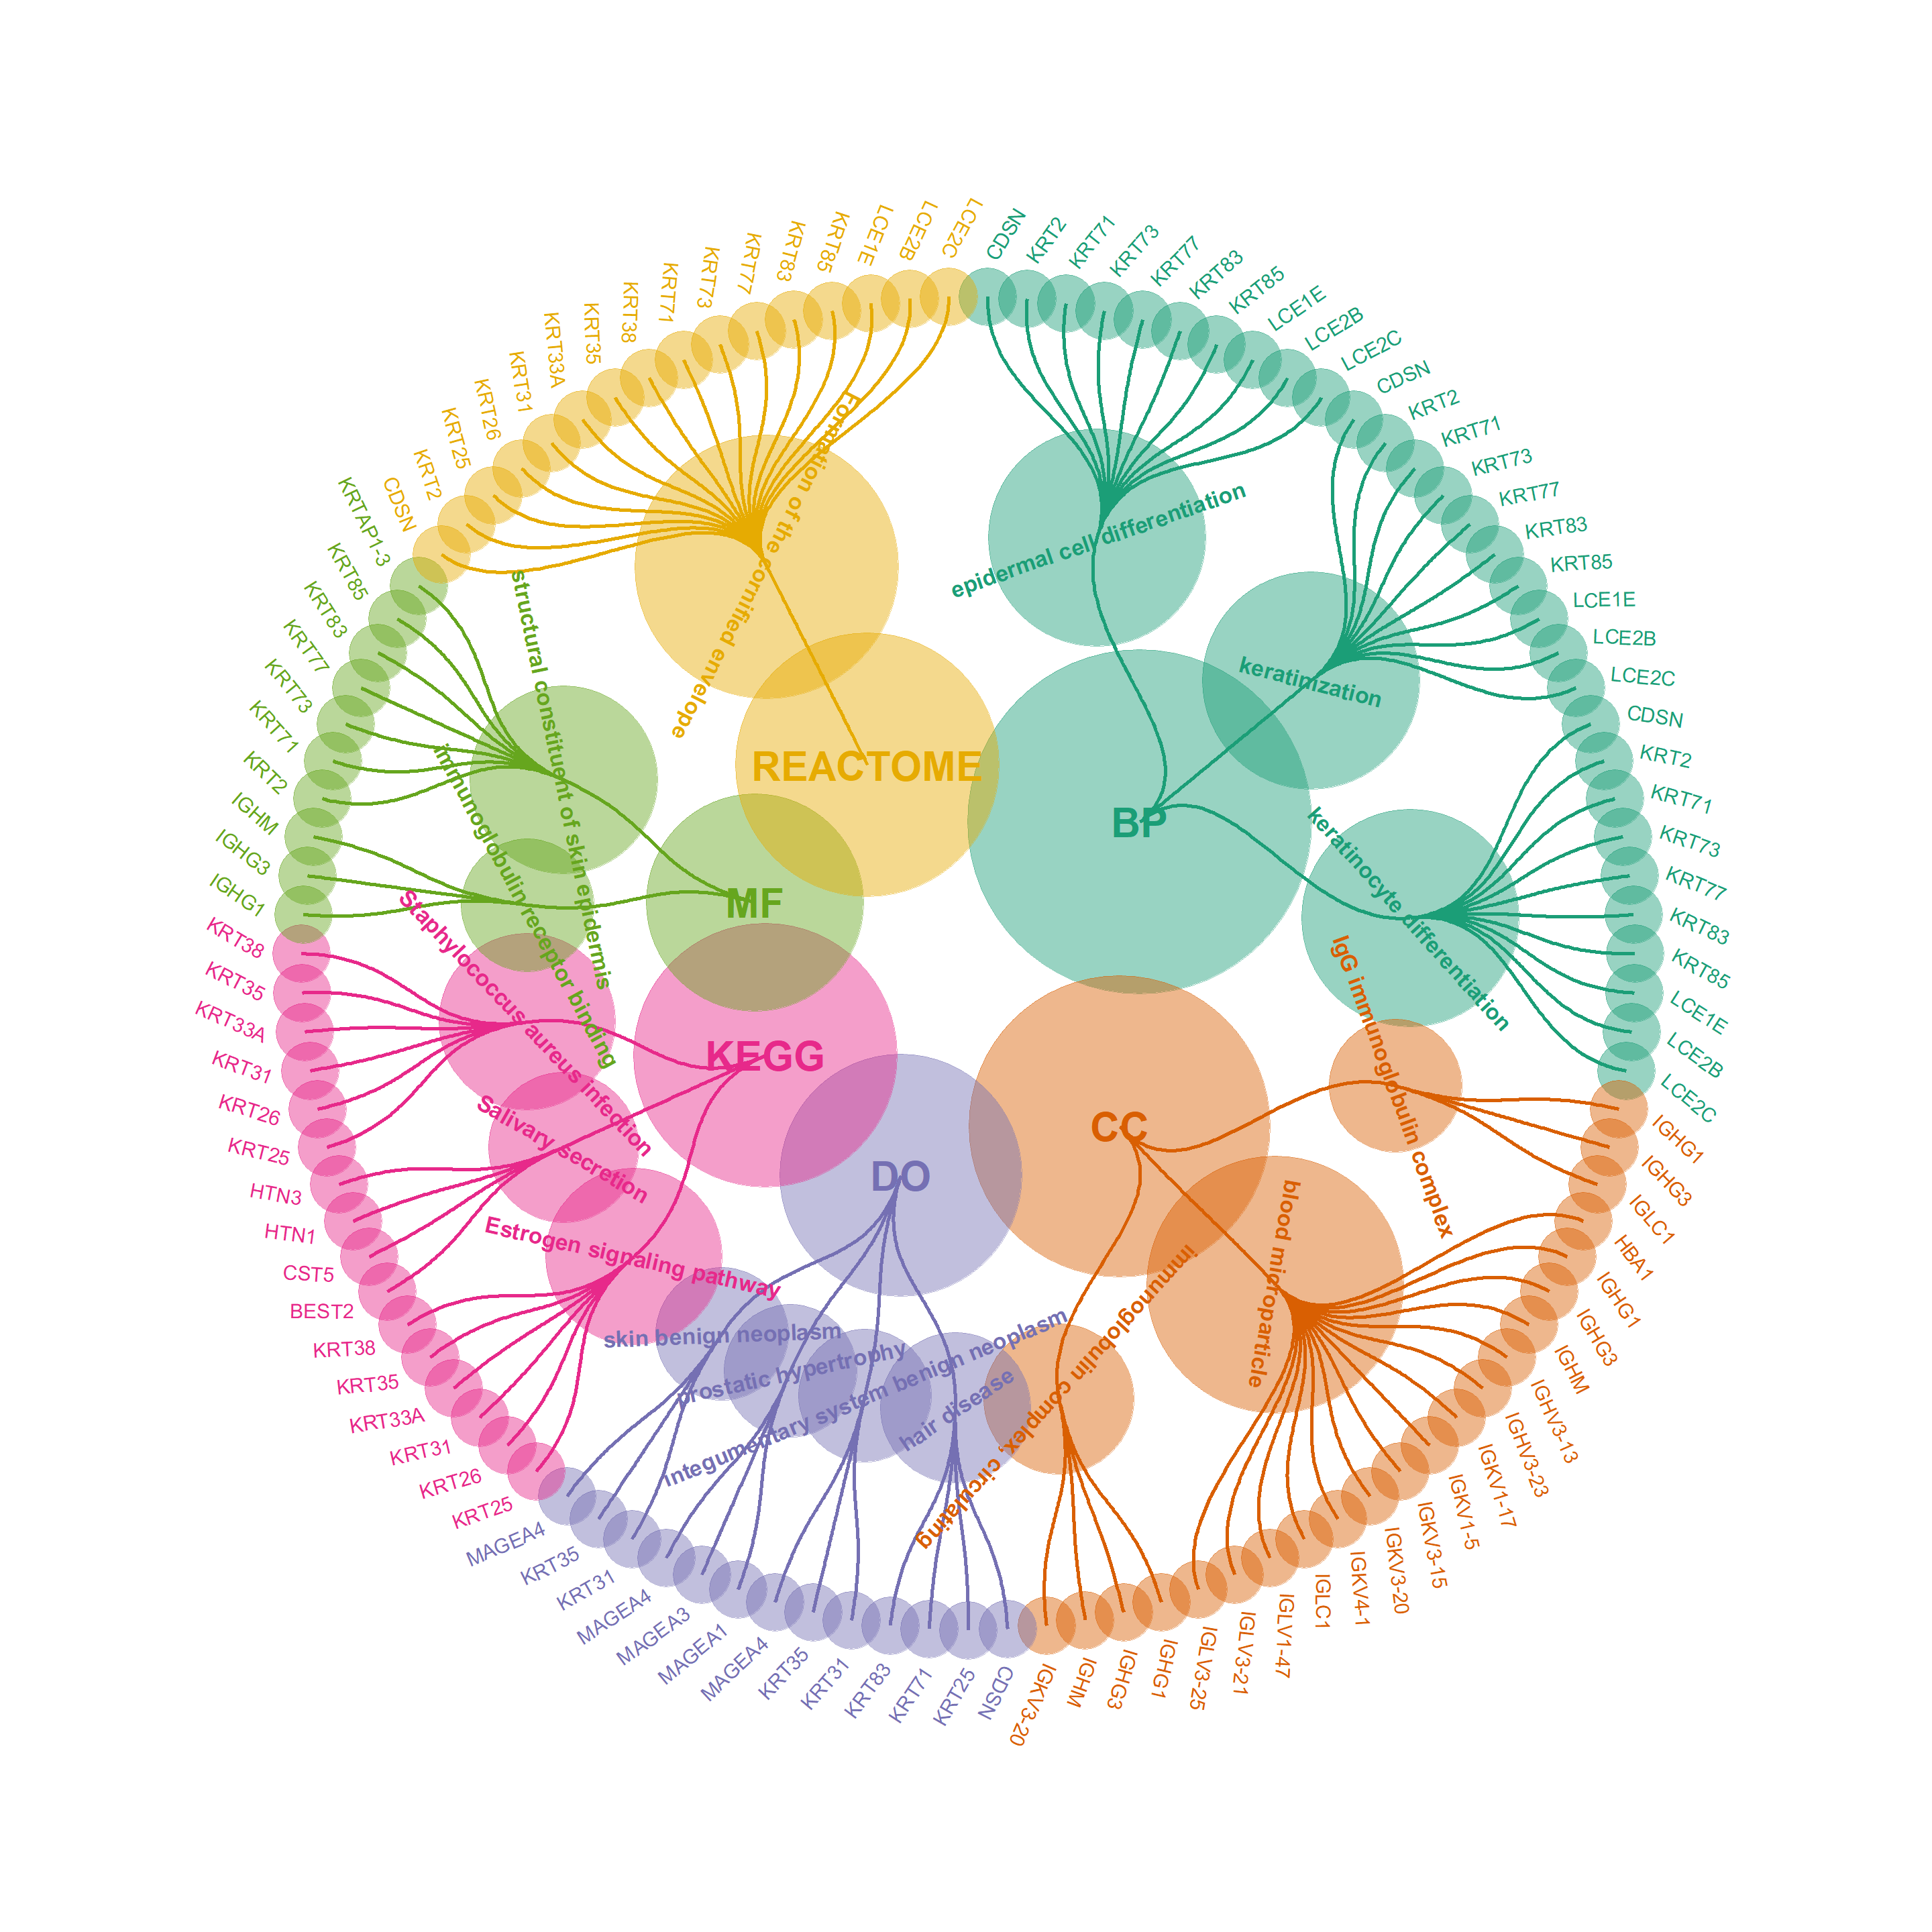
Subsequently, extensive gene enrichment analyses are conducted using packages such as clusterProfiler, DOSE, and ReactomePA, covering biological processes, cellular components, molecular functions, disease ontology, and Reactome pathways.

Finally, the script generates complex gene-pathway network diagrams through new_ggraph to visually depict the roles and connections of differentially expressed genes across various biological pathways, thus providing deep insights into the molecular mechanisms of diseases.

The application of this methodology not only enhances the depth of the analysis but also improves the interpretability and practicality of the results.

library(TransProR)
library(clusterProfiler)
library(org.Hs.eg.db)
library(DOSE)
library(ReactomePA)
library(dplyr)

10.1 Load data

tumor <- readRDS("../test_TransProR/generated_data1/removebatch_SKCM_Skin_TCGA_exp_tumor.rds")
normal <- readRDS('../test_TransProR/generated_data1/removebatch_SKCM_Skin_Normal_TCGA_GTEX_count.rds')
# Merge the datasets, ensuring both have genes as row names
all_count_exp <- merge(tumor, normal, by = "row.names")
all_count_exp <- tibble::column_to_rownames(all_count_exp, var = "Row.names")  # Set the row names

# Drawing data
all_count_exp <- log_transform(all_count_exp)
[1] "log2 transform finished"
DEG_deseq2 <- readRDS('../test_TransProR/Select DEGs/DEG_deseq2.Rdata')
#head(all_count_exp, 1)
head(DEG_deseq2, 5)
          baseMean log2FoldChange      lfcSE      stat pvalue padj change
A1BG      134.6084      -2.549682 0.05677219 -44.91075      0    0   down
A2M     30208.9912       3.251168 0.08394645  38.72907      0    0     up
AADACL2   801.4538      -8.229956 0.18969649 -43.38486      0    0   down
AARS2    1153.5493       1.624753 0.03283522  49.48202      0    0 stable
AARSD1    567.8672      -2.082289 0.02275703 -91.50088      0    0 stable

10.2 Convert from SYMBOL to ENTREZID

# Convert from SYMBOL to ENTREZID for convenient enrichment analysis later. It's crucial to do this now as a direct conversion may result in a reduced set of genes due to non-one-to-one correspondence.

# DEG_deseq2
# Retrieve gene list
gene <- rownames(DEG_deseq2)
# Perform conversion
gene = bitr(gene, fromType="SYMBOL", toType="ENTREZID", OrgDb="org.Hs.eg.db")
'select()' returned 1:many mapping between keys and columns
Warning in bitr(gene, fromType = "SYMBOL", toType = "ENTREZID", OrgDb =
"org.Hs.eg.db"): 43.37% of input gene IDs are fail to map...
# Remove duplicates and merge
gene <- dplyr::distinct(gene, SYMBOL, .keep_all=TRUE)
# Extract the SYMBOL column as a vector from the first dataset
symbols_vector <- gene$SYMBOL
# Use the SYMBOL column to filter corresponding rows from the second dataset by row names
DEG_deseq2 <- DEG_deseq2[rownames(DEG_deseq2) %in% symbols_vector, ]
head(DEG_deseq2, 5)
          baseMean log2FoldChange      lfcSE      stat pvalue padj change
A1BG      134.6084      -2.549682 0.05677219 -44.91075      0    0   down
A2M     30208.9912       3.251168 0.08394645  38.72907      0    0     up
AADACL2   801.4538      -8.229956 0.18969649 -43.38486      0    0   down
AARS2    1153.5493       1.624753 0.03283522  49.48202      0    0 stable
AARSD1    567.8672      -2.082289 0.02275703 -91.50088      0    0 stable

10.3 Select differentially expressed genes

Diff_deseq2 <- filter_diff_genes(
  DEG_deseq2, 
  p_val_col = "pvalue", 
  log_fc_col = "log2FoldChange",
  p_val_threshold = 0.01, 
  log_fc_threshold = 8
  )
# First, obtain a list of gene names from the row names of the first dataset
gene_names <- rownames(Diff_deseq2)
# Find the matching rows in the second dataframe
matched_rows <- all_count_exp[gene_names, ]
# Calculate the mean for each row
averages <- rowMeans(matched_rows, na.rm = TRUE)
# Append the averages as a new column to the first dataframe
Diff_deseq2$average <- averages
Diff_deseq2$ID <- rownames(Diff_deseq2)
Diff_deseq2$changetype <- ifelse(Diff_deseq2$change == 'up', 1, -1)
# Define a small threshold value
small_value <- .Machine$double.xmin
# Before calculating -log10, replace zeroes with the small threshold value and assign it to a new column
Diff_deseq2$log_pvalue <- ifelse(Diff_deseq2$pvalue == 0, -log10(small_value), -log10(Diff_deseq2$pvalue))
# Extract the expression data corresponding to the differentially expressed genes
heatdata_deseq2 <- all_count_exp[rownames(Diff_deseq2), ]
#head(heatdata_deseq2, 1)

10.4 Diff_deseq2 Enrichment Analysis

10.4.1 Obtain the list of genes

gene <- rownames(Diff_deseq2)
## Convert
gene = bitr(gene, fromType="SYMBOL", toType="ENTREZID", OrgDb="org.Hs.eg.db")
'select()' returned 1:1 mapping between keys and columns
## Remove duplicates and merge
gene <- dplyr::distinct(gene, SYMBOL, .keep_all=TRUE)
gene_df <- data.frame(logFC=Diff_deseq2$log2FoldChange,
                      SYMBOL = rownames(Diff_deseq2))
gene_df <- merge(gene_df, gene, by="SYMBOL")
GO_deseq2 <- gene_df$ENTREZID

10.4.2 GO Analysis for Biological Processes (BP)

# Perform gene enrichment analysis
erich.go.BP_deseq2 <- enrichGO(
  gene = GO_deseq2,
  OrgDb = org.Hs.eg.db,
  keyType = "ENTREZID",
  ont = 'BP', # Other categories: "CC", "MF" for molecular function
  pvalueCutoff = 0.05,
  qvalueCutoff = 0.05,
  readable = TRUE)
erich.go.BP.outdata_deseq2 <- as.data.frame(erich.go.BP_deseq2)
# Uncomment to write output to CSV
# write.csv(erich.go.BP.outdata_deseq2, "E:/fruit/erich.go.BP.outdata.csv")
head(erich.go.BP.outdata_deseq2, 5)
                   ID                                         Description
GO:0002377 GO:0002377                           immunoglobulin production
GO:0002440 GO:0002440 production of molecular mediator of immune response
GO:0016064 GO:0016064             immunoglobulin mediated immune response
GO:0019724 GO:0019724                            B cell mediated immunity
GO:0002449 GO:0002449                        lymphocyte mediated immunity
           GeneRatio   BgRatio       pvalue     p.adjust       qvalue
GO:0002377    34/179 196/18870 2.480604e-33 2.909749e-30 2.909749e-30
GO:0002440    34/179 314/18870 3.023121e-26 1.773060e-23 1.773060e-23
GO:0016064    29/179 205/18870 7.968166e-26 3.115553e-23 3.115553e-23
GO:0019724    29/179 208/18870 1.224253e-25 3.590121e-23 3.590121e-23
GO:0002449    30/179 368/18870 1.235430e-19 2.898319e-17 2.898319e-17
                                                                                                                                                                                                                                                                                                          geneID
GO:0002377 IGKV1-16/IGKV1-17/IGKV1-27/IGKV1-5/IGKV1-6/IGKV1-9/IGKV2D-29/IGKV3-15/IGKV3-20/IGKV3D-20/IGKV4-1/IGKV5-2/IGLV1-40/IGLV1-44/IGLV1-47/IGLV2-11/IGLV2-14/IGLV2-23/IGLV3-1/IGLV3-10/IGLV3-19/IGLV3-21/IGLV3-25/IGLV3-27/IGLV3-9/IGLV4-60/IGLV4-69/IGLV5-45/IGLV6-57/IGLV7-43/IGLV8-61/IGLV9-49/TREX1/XBP1
GO:0002440 IGKV1-16/IGKV1-17/IGKV1-27/IGKV1-5/IGKV1-6/IGKV1-9/IGKV2D-29/IGKV3-15/IGKV3-20/IGKV3D-20/IGKV4-1/IGKV5-2/IGLV1-40/IGLV1-44/IGLV1-47/IGLV2-11/IGLV2-14/IGLV2-23/IGLV3-1/IGLV3-10/IGLV3-19/IGLV3-21/IGLV3-25/IGLV3-27/IGLV3-9/IGLV4-60/IGLV4-69/IGLV5-45/IGLV6-57/IGLV7-43/IGLV8-61/IGLV9-49/TREX1/XBP1
GO:0016064                                                IGHG1/IGHG3/IGHM/IGHV1-18/IGHV1-24/IGHV1-58/IGHV1-69/IGHV1-69-2/IGHV2-26/IGHV3-11/IGHV3-13/IGHV3-15/IGHV3-21/IGHV3-23/IGHV3-30/IGHV3-43/IGHV3-48/IGHV3-49/IGHV3-53/IGHV3-66/IGHV3-73/IGHV4-28/IGHV4-31/IGHV4-34/IGHV4-39/IGHV4-59/IGHV5-51/IGLC1/TREX1
GO:0019724                                                IGHG1/IGHG3/IGHM/IGHV1-18/IGHV1-24/IGHV1-58/IGHV1-69/IGHV1-69-2/IGHV2-26/IGHV3-11/IGHV3-13/IGHV3-15/IGHV3-21/IGHV3-23/IGHV3-30/IGHV3-43/IGHV3-48/IGHV3-49/IGHV3-53/IGHV3-66/IGHV3-73/IGHV4-28/IGHV4-31/IGHV4-34/IGHV4-39/IGHV4-59/IGHV5-51/IGLC1/TREX1
GO:0002449                                         CLEC2A/IGHG1/IGHG3/IGHM/IGHV1-18/IGHV1-24/IGHV1-58/IGHV1-69/IGHV1-69-2/IGHV2-26/IGHV3-11/IGHV3-13/IGHV3-15/IGHV3-21/IGHV3-23/IGHV3-30/IGHV3-43/IGHV3-48/IGHV3-49/IGHV3-53/IGHV3-66/IGHV3-73/IGHV4-28/IGHV4-31/IGHV4-34/IGHV4-39/IGHV4-59/IGHV5-51/IGLC1/TREX1
           Count
GO:0002377    34
GO:0002440    34
GO:0016064    29
GO:0019724    29
GO:0002449    30

10.4.3 GO Analysis for Molecular Functions (MF)

# Perform gene enrichment analysis
erich.go.MF_deseq2 <- enrichGO(
  gene = GO_deseq2,
  OrgDb = org.Hs.eg.db,
  keyType = "ENTREZID",
  ont = 'MF', # Other categories: "CC", "MF" for molecular function
  pvalueCutoff = 0.05,
  qvalueCutoff = 0.05,
  readable = TRUE)

erich.go.MF.outdata_deseq2 <- as.data.frame(erich.go.MF_deseq2)
# Uncomment to write output to CSV
# write.csv(erich.go.MF.outdata_deseq2, "E:/fruit/erich.go.MF.outdata.csv")

head(erich.go.MF.outdata_deseq2, 5)
                   ID                              Description GeneRatio
GO:0003823 GO:0003823                          antigen binding    49/188
GO:0030280 GO:0030280 structural constituent of skin epidermis     7/188
GO:0034987 GO:0034987          immunoglobulin receptor binding     3/188
             BgRatio       pvalue     p.adjust       qvalue
GO:0003823 178/18496 1.931643e-57 4.829108e-55 4.829108e-55
GO:0030280  36/18496 6.521227e-08 8.151534e-06 8.151534e-06
GO:0034987  16/18496 5.249729e-04 4.374774e-02 4.374774e-02
                                                                                                                                                                                                                                                                                                                                                                                                                                            geneID
GO:0003823 IGHG1/IGHG3/IGHM/IGHV1-18/IGHV1-24/IGHV1-58/IGHV1-69/IGHV1-69-2/IGHV2-26/IGHV3-11/IGHV3-13/IGHV3-15/IGHV3-21/IGHV3-23/IGHV3-30/IGHV3-43/IGHV3-48/IGHV3-49/IGHV3-53/IGHV3-66/IGHV3-73/IGHV4-28/IGHV4-31/IGHV4-34/IGHV4-39/IGHV4-59/IGHV5-51/IGKV1-16/IGKV1-17/IGKV1-5/IGKV3-15/IGKV3-20/IGKV4-1/IGKV5-2/IGLC1/IGLV1-40/IGLV1-44/IGLV1-47/IGLV2-11/IGLV2-14/IGLV2-23/IGLV3-1/IGLV3-19/IGLV3-21/IGLV3-25/IGLV3-27/IGLV6-57/IGLV7-43/TRBV28
GO:0030280                                                                                                                                                                                                                                                                                                                                                                                             KRT2/KRT71/KRT73/KRT77/KRT83/KRT85/KRTAP1-3
GO:0034987                                                                                                                                                                                                                                                                                                                                                                                                                        IGHG1/IGHG3/IGHM
           Count
GO:0003823    49
GO:0030280     7
GO:0034987     3

10.4.4 GO Analysis for Cellular Components (CC)

# Perform gene enrichment analysis
erich.go.CC_deseq2 <- enrichGO(
  gene = GO_deseq2,
  OrgDb = org.Hs.eg.db,
  keyType = "ENTREZID",
  ont = 'CC', # Other categories: "CC", "MF" for molecular function
  pvalueCutoff = 0.05,
  qvalueCutoff = 0.05,
  readable = TRUE)

erich.go.CC.outdata_deseq2 <- as.data.frame(erich.go.CC_deseq2)
# Uncomment to write output to CSV
# write.csv(erich.go.CC.outdata_deseq2, "E:/fruit/erich.go.CC.outdata.csv")

10.4.5 KEGG Analysis

kegg.out_deseq2 = enrichKEGG(
  gene = GO_deseq2,
  organism = "hsa",
  keyType = "kegg",
  pvalueCutoff = 0.15,
  pAdjustMethod = "BH",
  qvalueCutoff = 0.15)
Reading KEGG annotation online: "https://rest.kegg.jp/link/hsa/pathway"...
Reading KEGG annotation online: "https://rest.kegg.jp/list/pathway/hsa"...
kegg.out.outdata_deseq2 <- as.data.frame(kegg.out_deseq2)
# Uncomment to export the data, which are in ENTREZID format
# write.csv(kegg.out.outdata_deseq2, "E:/kegg.out.outdata.csv")

##### Convert numeric Entrez gene IDs or Ensembl gene IDs from above code to symbols
library(org.Hs.eg.db)
kegg.out1_deseq2 = as.data.frame(kegg.out_deseq2)
ENTREZID = strsplit(kegg.out1_deseq2$geneID, "/")
symbol = sapply(ENTREZID, function(x) {
  y = bitr(x, fromType = "ENTREZID", toType = "SYMBOL", OrgDb = "org.Hs.eg.db")
  # In case of multiple matches, take the first one
  y = y[!duplicated(y$ENTREZID), -1]
  y = paste(y, collapse = "/")
})
'select()' returned 1:1 mapping between keys and columns
kegg.out1_deseq2$geneID = symbol
kegg.out1.outdata_deseq2 <- as.data.frame(kegg.out1_deseq2)
# Uncomment to export the converted data
# write.csv(kegg.out1.outdata_deseq2, "E:/fruit/kegg.out1.outdata.csv")
head(kegg.out.outdata_deseq2, 5)
                   category                   subcategory       ID
hsa05150     Human Diseases Infectious disease: bacterial hsa05150
hsa04915 Organismal Systems              Endocrine system hsa04915
hsa04970 Organismal Systems              Digestive system hsa04970
                             Description GeneRatio  BgRatio       pvalue
hsa05150 Staphylococcus aureus infection      6/43 100/8842 7.819914e-06
hsa04915      Estrogen signaling pathway      6/43 139/8842 5.118328e-05
hsa04970              Salivary secretion      4/43  97/8842 1.210284e-03
             p.adjust       qvalue                            geneID Count
hsa05150 0.0006255931 0.0005926672 147183/353288/3881/3883/3886/8687     6
hsa04915 0.0020473312 0.0019395769 147183/353288/3881/3883/3886/8687     6
hsa04970 0.0322742503 0.0305756056              54831/1473/3346/3347     4
head(kegg.out1.outdata_deseq2, 5)
                   category                   subcategory       ID
hsa05150     Human Diseases Infectious disease: bacterial hsa05150
hsa04915 Organismal Systems              Endocrine system hsa04915
hsa04970 Organismal Systems              Digestive system hsa04970
                             Description GeneRatio  BgRatio       pvalue
hsa05150 Staphylococcus aureus infection      6/43 100/8842 7.819914e-06
hsa04915      Estrogen signaling pathway      6/43 139/8842 5.118328e-05
hsa04970              Salivary secretion      4/43  97/8842 1.210284e-03
             p.adjust       qvalue                               geneID Count
hsa05150 0.0006255931 0.0005926672 KRT25/KRT26/KRT31/KRT33A/KRT35/KRT38     6
hsa04915 0.0020473312 0.0019395769 KRT25/KRT26/KRT31/KRT33A/KRT35/KRT38     6
hsa04970 0.0322742503 0.0305756056                 BEST2/CST5/HTN1/HTN3     4

10.4.6 DO Analysis

erich.go.DO_deseq2 = enrichDO(gene = GO_deseq2,
                              ont = "DO", # Other categories: "CC", "MF" for molecular function
                              pvalueCutoff = 0.5,
                              qvalueCutoff = 0.5,
                              readable = TRUE)

erich.go.DO.outdata_deseq2 <- as.data.frame(erich.go.DO_deseq2)
# Uncomment to export the data
# write.csv(erich.go.DO.outdata_deseq2, "E:/fruit/erich.go.DO.outdata.csv")
head(erich.go.DO.outdata_deseq2, 5)
                       ID                          Description GeneRatio
DOID:0060121 DOID:0060121 integumentary system benign neoplasm      3/71
DOID:3165       DOID:3165                 skin benign neoplasm      3/71
DOID:11132     DOID:11132                prostatic hypertrophy      3/71
DOID:421         DOID:421                         hair disease      4/71
DOID:2345       DOID:2345    plasma protein metabolism disease      2/71
              BgRatio      pvalue  p.adjust    qvalue                 geneID
DOID:0060121 27/10312 0.000812625 0.1178306 0.1178306     KRT31/KRT35/MAGEA4
DOID:3165    27/10312 0.000812625 0.1178306 0.1178306     KRT31/KRT35/MAGEA4
DOID:11132   34/10312 0.001606147 0.1552608 0.1552608   MAGEA1/MAGEA3/MAGEA4
DOID:421     81/10312 0.002303062 0.1669720 0.1669720 CDSN/KRT25/KRT71/KRT83
DOID:2345    16/10312 0.005269780 0.2547060 0.2547060         CPN1/SERPINA12
             Count
DOID:0060121     3
DOID:3165        3
DOID:11132       3
DOID:421         4
DOID:2345        2

10.4.7 Reactome Pathway Analysis

erich.go.Reactome_deseq2 <- enrichPathway(gene = GO_deseq2, pvalueCutoff = 0.05, readable = TRUE)

erich.go.Reactome.outdata_deseq2 <- as.data.frame(erich.go.Reactome_deseq2)
# Uncomment to export the data
# write.csv(erich.go.Reactome.outdata_deseq2, "E:/fruit/erich.go.Reactome.outdata.csv")
head(erich.go.Reactome.outdata_deseq2, 5)
                         ID                         Description GeneRatio
R-HSA-6805567 R-HSA-6805567                      Keratinization     50/97
R-HSA-6809371 R-HSA-6809371 Formation of the cornified envelope     16/97
                BgRatio       pvalue     p.adjust       qvalue
R-HSA-6805567 214/11009 3.658421e-61 6.694910e-59 6.694910e-59
R-HSA-6809371 129/11009 1.744227e-14 1.595968e-12 1.595968e-12
                                                                                                                                                                                                                                                                                                                                                                                                                                         geneID
R-HSA-6805567 CDSN/KRT2/KRT25/KRT26/KRT31/KRT33A/KRT35/KRT38/KRT71/KRT73/KRT77/KRT83/KRT85/KRTAP1-1/KRTAP1-3/KRTAP10-1/KRTAP10-10/KRTAP10-11/KRTAP10-3/KRTAP10-5/KRTAP10-6/KRTAP10-7/KRTAP10-8/KRTAP11-1/KRTAP12-1/KRTAP12-2/KRTAP16-1/KRTAP17-1/KRTAP2-1/KRTAP2-2/KRTAP2-4/KRTAP24-1/KRTAP26-1/KRTAP3-1/KRTAP3-2/KRTAP3-3/KRTAP4-2/KRTAP4-3/KRTAP4-4/KRTAP4-6/KRTAP4-8/KRTAP4-9/KRTAP8-1/KRTAP9-3/KRTAP9-4/KRTAP9-7/KRTAP9-8/LCE1E/LCE2B/LCE2C
R-HSA-6809371                                                                                                                                                                                                                                                                                                                                    CDSN/KRT2/KRT25/KRT26/KRT31/KRT33A/KRT35/KRT38/KRT71/KRT73/KRT77/KRT83/KRT85/LCE1E/LCE2B/LCE2C
              Count
R-HSA-6805567    50
R-HSA-6809371    16

11 new_ggraph usage

newggraph <- new_ggraph(
  BP_dataframe = erich.go.BP.outdata_deseq2, 
  BP_ids = c("GO:0009913", "GO:0031424", "GO:0030216"), 
  KEGG_dataframe = kegg.out1.outdata_deseq2, 
  KEGG_ids = c("hsa05150", "hsa04915", "hsa04970"), 
  MF_dataframe = erich.go.MF.outdata_deseq2, 
  MF_ids = c("GO:0030280", "GO:0034987"), 
  REACTOME_dataframe = erich.go.Reactome.outdata_deseq2, 
  REACTOME_ids = c("R-HSA-6809371"), 
  CC_dataframe = erich.go.CC.outdata_deseq2, 
  CC_ids = c("GO:0072562", "GO:0042571", "GO:0071735"), 
  DO_dataframe = erich.go.DO.outdata_deseq2, 
  DO_ids = c("DOID:0060121", "DOID:3165", "DOID:11132", "DOID:421"))

newggraph  

12 Reference